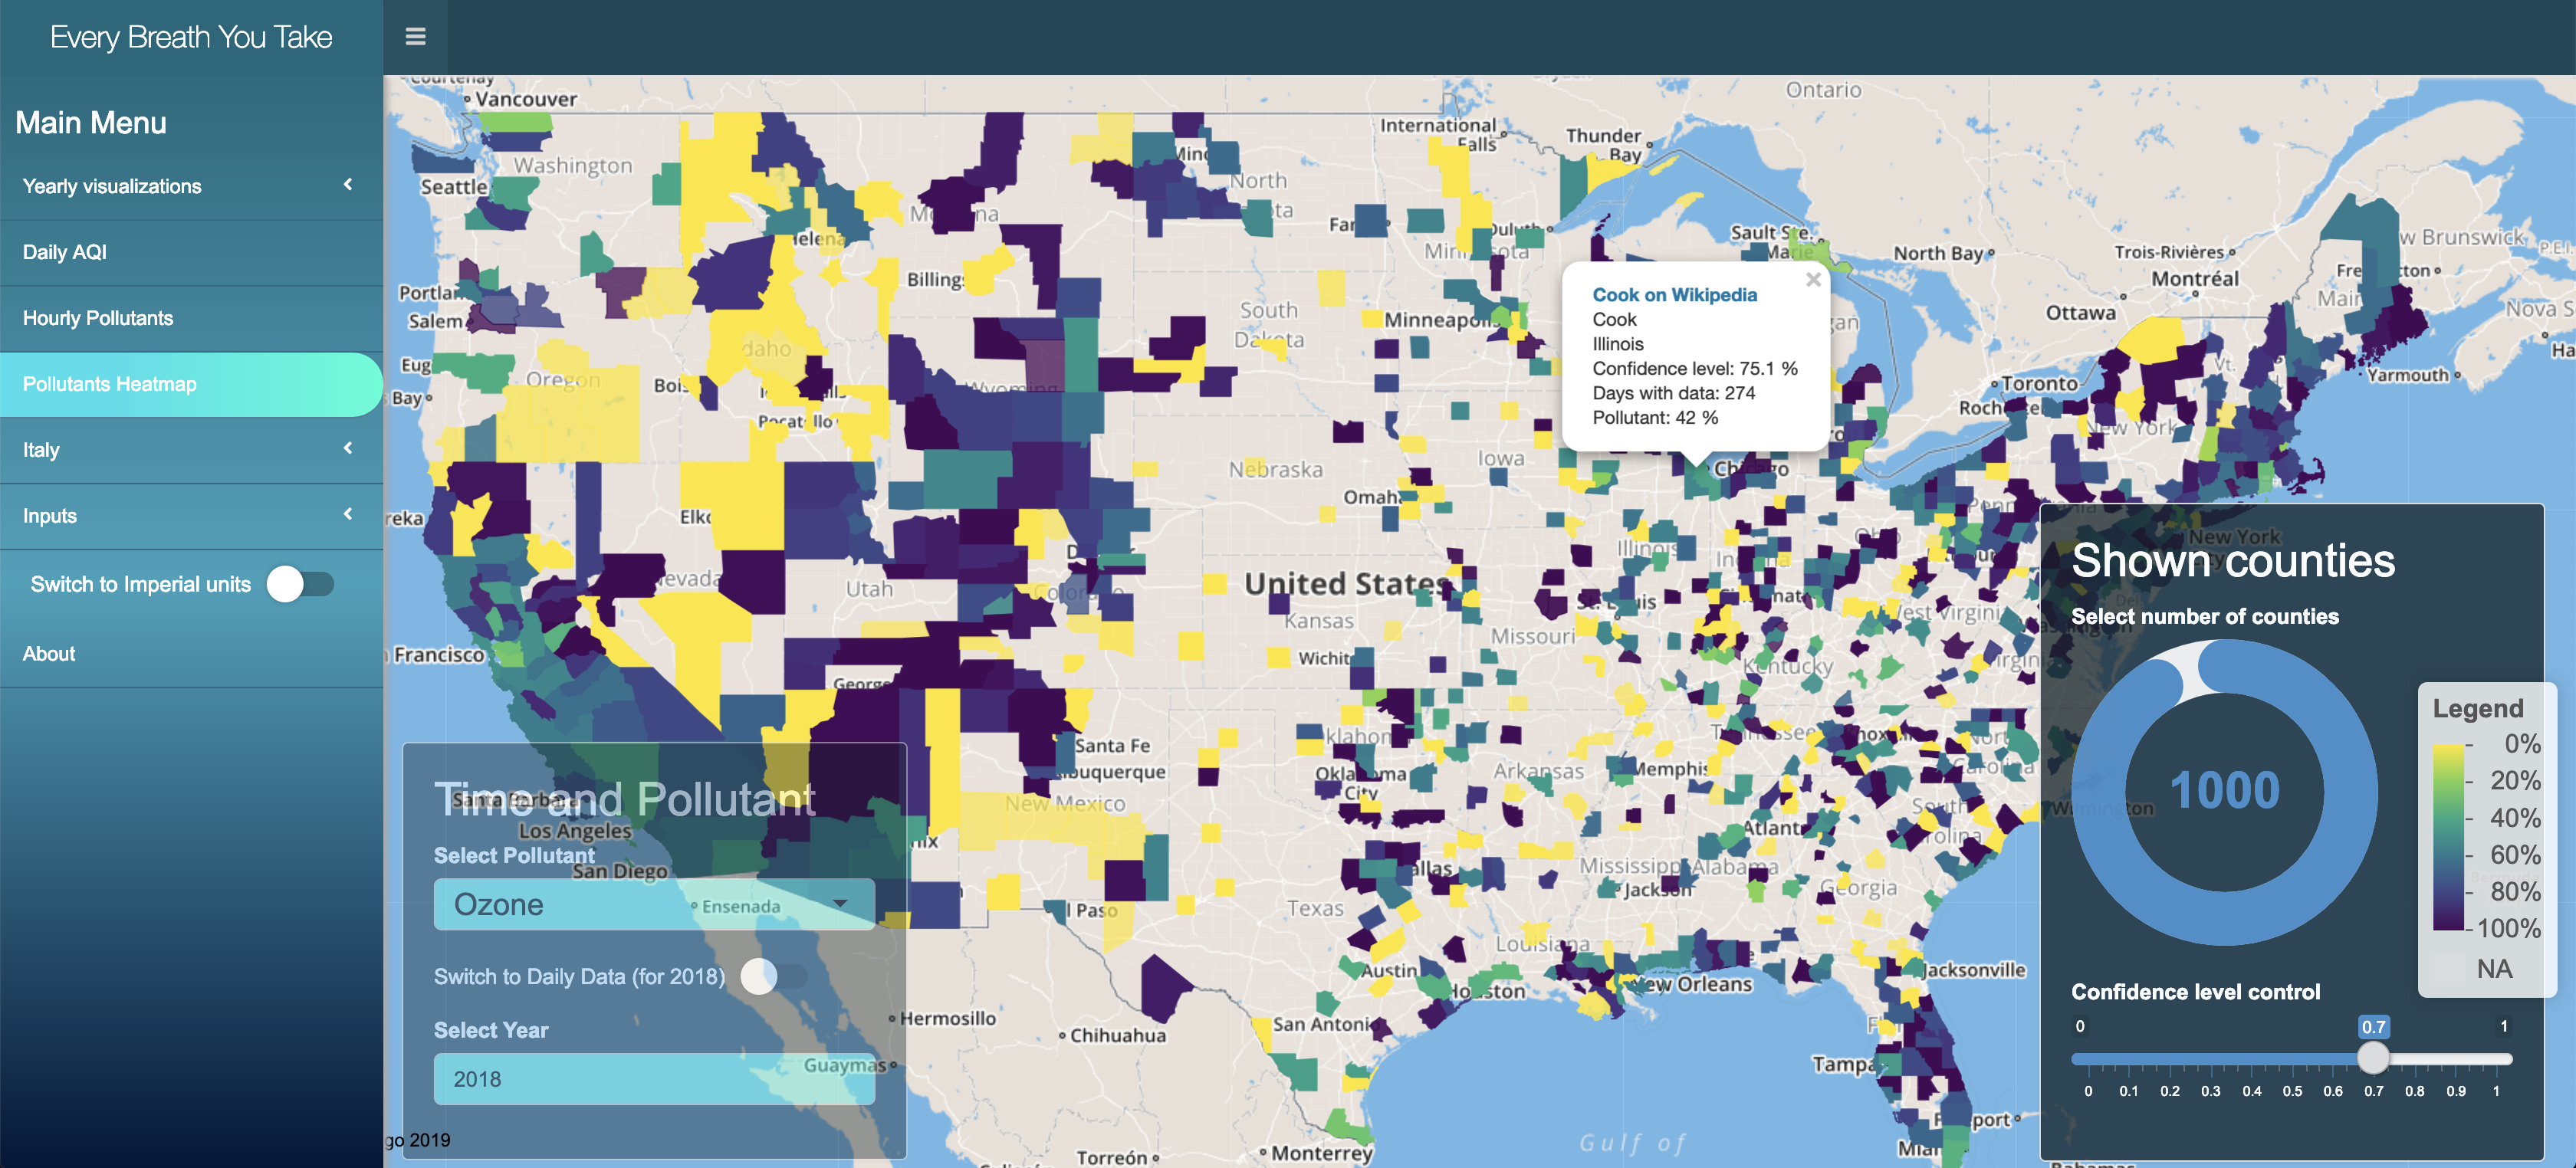
This is the second project for the CS 424 Visualization and Visual Analytics class at UIC. It consists in various visualizations and interactive plots in a web application created using the Shiny library for R. The visualizations are about the Air Quality dataset by County in the United States and Italy, concentrating on the yearly, daily and hourly data.
You can access the application from here .
You can learn more about the application here.
The code for the application is available on github .
An short video demonstration of the application is available on youtube .