This page contains the link to the visualization solution optimized for the EVL classroom wall and a description of how to use the application and the things that can be done with it.
To use this application follow the following steps :
The home page consists of a shiny dashboard with a side menu to choose what type of visualization user wants to see. The side menu has two options:
- One County - visualization consisting of one county.
- Multiple County - visualization consisting of more than one county
One the user select a side menu option, the corresponding page for the visualization loads.
- One County:
In this page, there are three input options for the user to select. The user has to select one of the available options in the drop down menu in a sequential order.
- Year
- State
- County
The user will then be able to see the different visualization on the screen below by navigating the different tabs provided in the panels below.
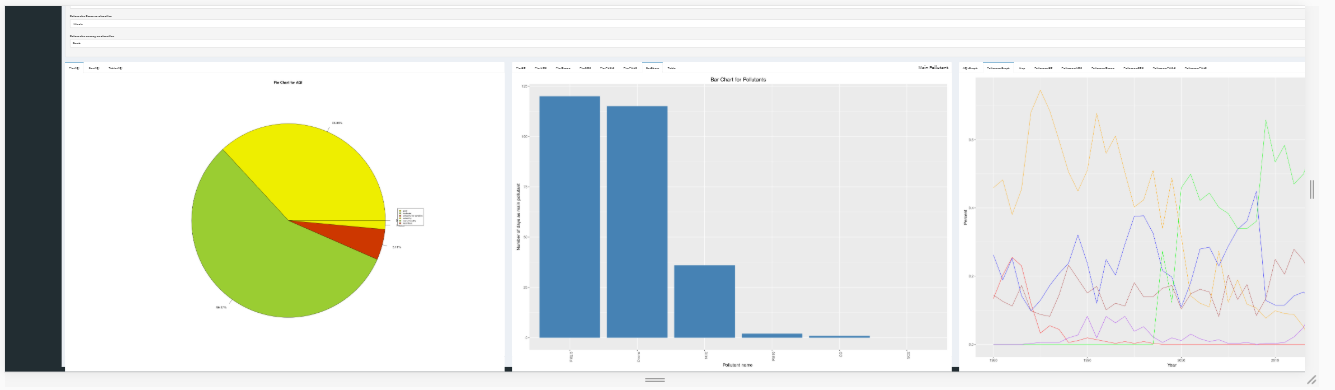
The first panel has three visualizations for the Air Quality of the state,county and year selected by the user:
- pie chart showing the percentage of days where the AQI could be good / moderate / unhealthy for sensitive / unhealthy / very unhealthy / hazardous
- a bar chart showing the number of days where the AQI could be good / moderate / unhealthy for sensitive / unhealthy / very unhealthy / hazardous
- table showing the number of days where the AQI could be good / moderate / unhealthy for sensitive / unhealthy / very unhealthy / hazardous
The second panel has eight visualizations based on the user input of state , county and year:
pie chart for each individual pollutant (CO, NO2, Ozone, SO2, PM2.5, PM10 ) showing the percentage of days in the year with that pollutant as the main pollutant (6 charts)
bar chart showing the number of CO, NO2, Ozone, SO2, PM2.5, PM10 days as the main pollutant
table showing the number of CO, NO2, Ozone, SO2, PM2.5, PM10 days as the main pollutant
The third panel has 9 visualizations based on the user input of state , county and year:
- a line graph using the annual data from 1980-2018 showing lines for the median, 90th percentile, and max AQI over those years (i.e. the graph should have 3 lines)
- a line graph showing the percentages over the years for days CO / days NO2 / days Ozone, days SO2 / days PM2.5 / days pm10 (i.e. the graph should have 6 lines)
- 6 tables showing the percentages over the years for days CO / days NO2 / days Ozone, days SO2 / days PM2.5 / days pm10
- location of the chosen county on a pannable and zoomable world map
Here is a snapshot from the application .