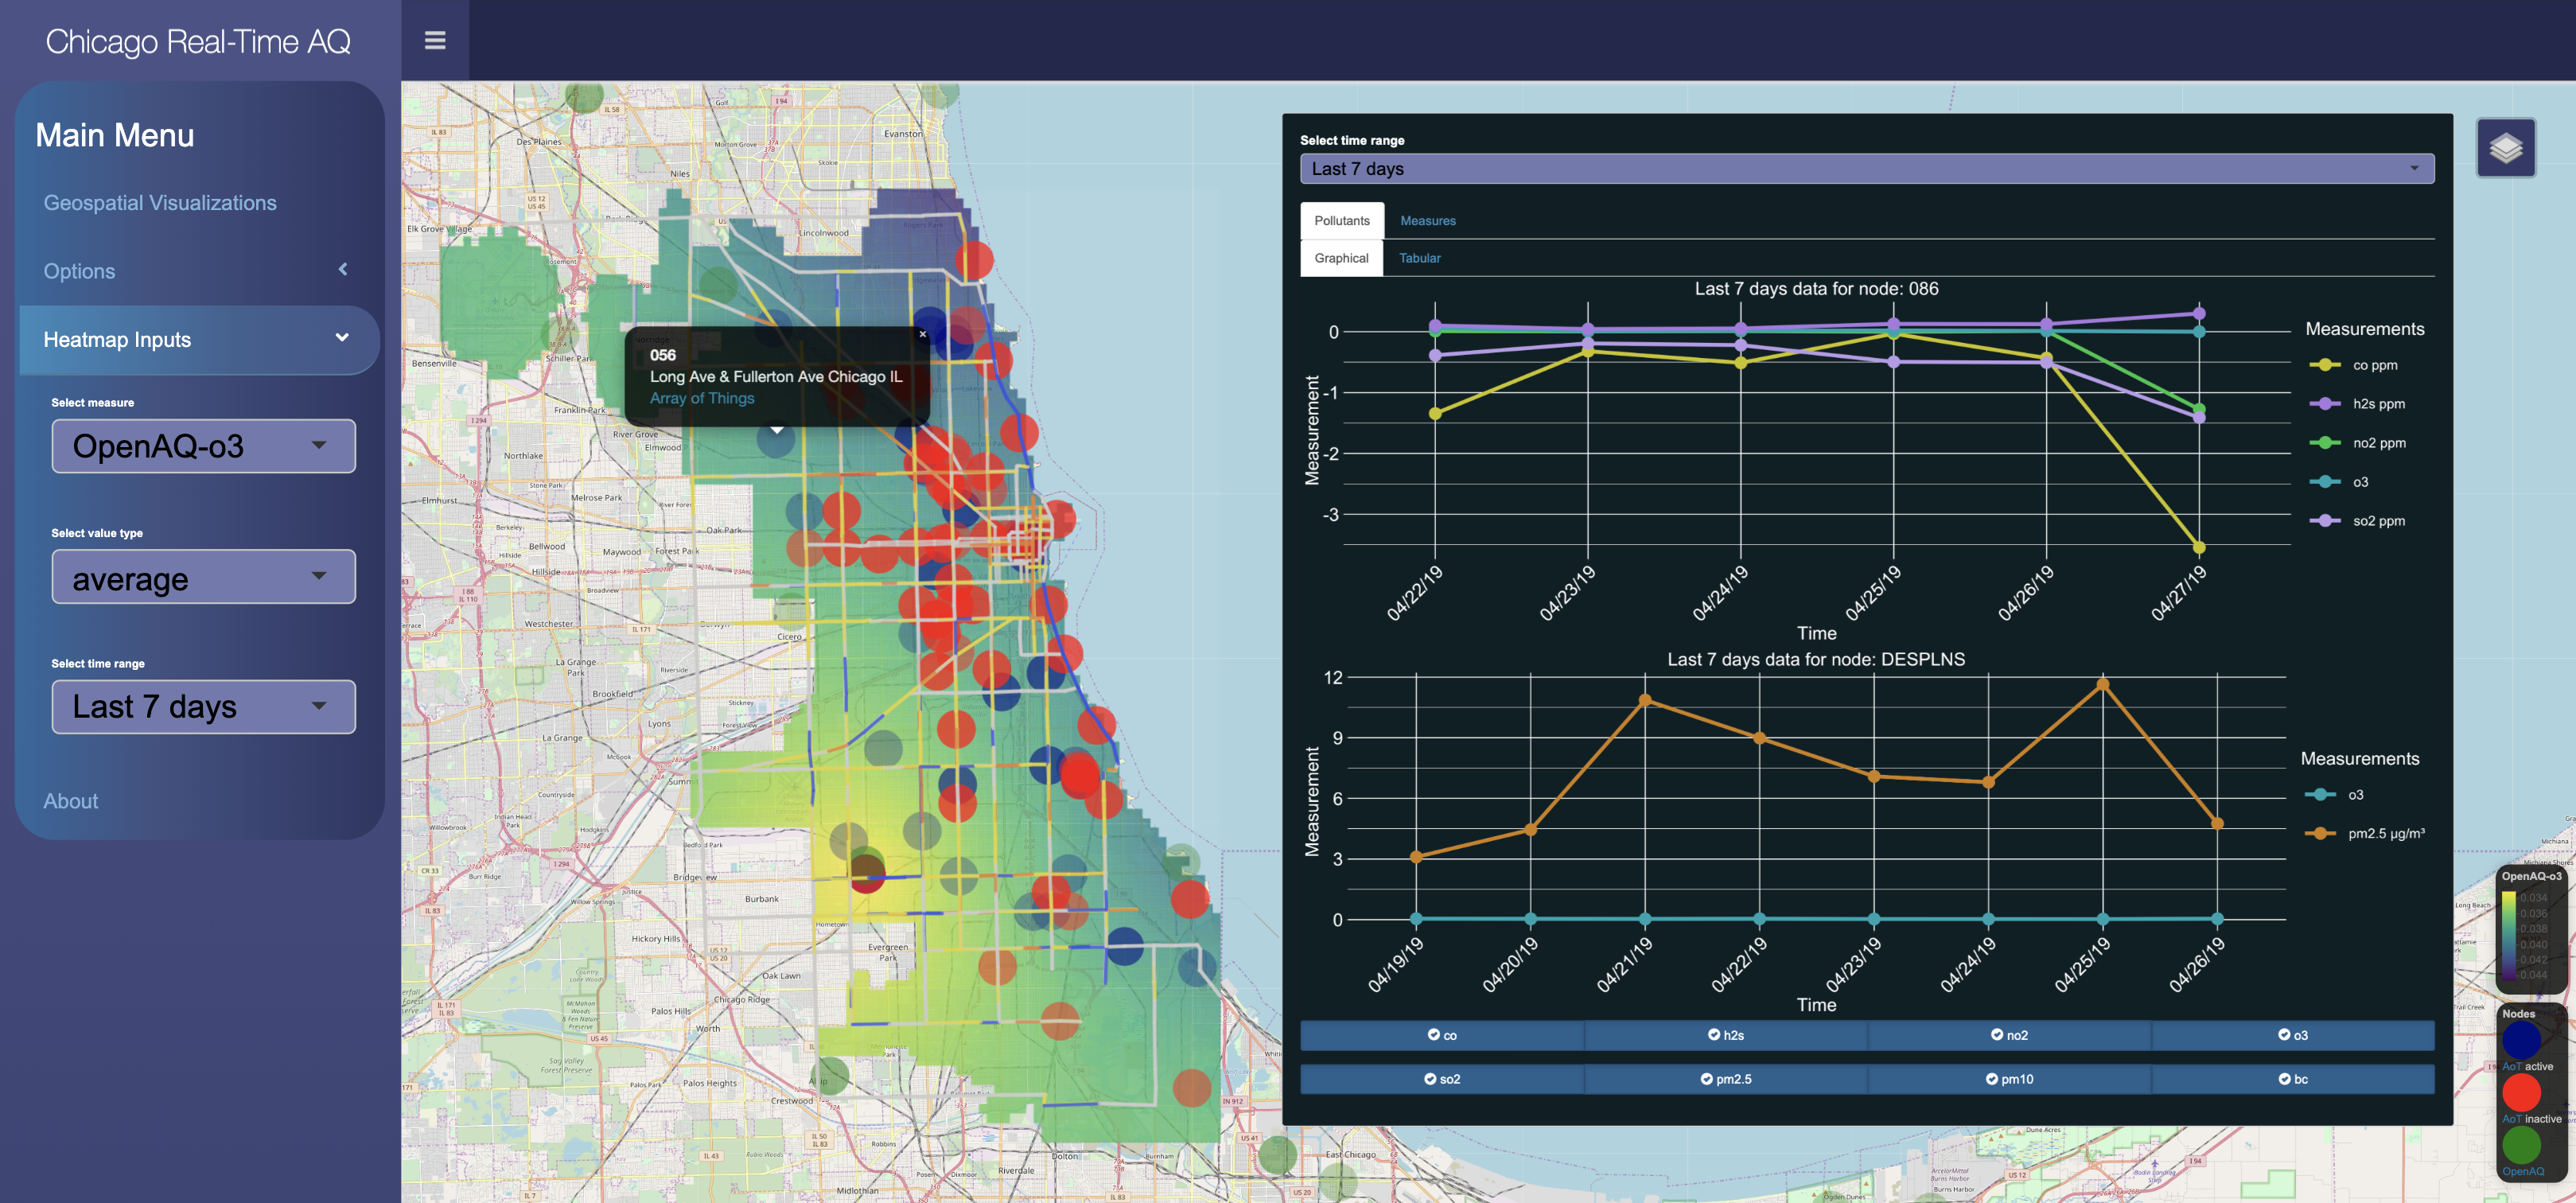
This is the third project for the CS 424 Visualization and Visual Analytics class at UIC. It consists in Chicago real-time air quality and weather data visualizations in an interactive web application created using the R Shiny library.
You can access the application from here .
You can learn more about the application here.
The code for the application is available on github .
An short video demonstration of the application is available on youtube .